
Understanding and measuring chromatic dispersion

By: M. R. (Mike) Wilder, Anritsu Company
A challenge for higher speeds
What is chromatic dispersion?
Dispersion-shifting fibers
Testing for chromatic dispersion
Supporting network operations
As optical pulses travel along a glass fiber, each pulse spreads out and loses peak energy. In single-mode fibers, this pulse broadening is primarily caused by chromatic dispersion, which generally results from different frequencies of light traveling at different velocities through silica glass.
The laser source that produces the optic pulse emits a range of frequencies. A distributed feedback laser's output may have a spectral width of 40 to 50 megahertz while the spectral width of a Fabry-Perot laser may be several nanometers wide. The wider the spectral width, the more optical frequencies the pulse contains and the faster it will spread. This pulse spreading is continuous over the length of the fiber span, so the further the pulse travels, the more it spreads out.
Chromatic dispersion was not much of a problem with earlier transmission systems for a variety of reasons. The transmission rates were low enough that the pulses could spread out slightly and not interfere with adjacent pulses. Also, the single transmission wavelength was located near the wavelength of minimum dispersion, which significantly decreased the spread of the pulse over a given distance. Finally, before the power of the optical signal dropped below a critical level, the signal passed through a regenerator. Although the primary function of the regenerator was to boost the signal power, it also re-timed and reshaped the original signal, thereby eliminating the effects of chromatic dispersion every 60 or 70 km.
Today, with 10 Gbit/s or higher transmission rates, there is little room for a pulse to spread before it begins to interfere with adjacent pulses. Also, when the signal power is reduced to a low level, optical amplifiers are used to boost the power without regenerating the signal , so the pulse spreading continues over a long distance.
Another aspect of chromatic dispersion has been found in dense wavelength-division multiplexing (DWDM) applications. Closely spaced wavelengths of relatively high power traveling down a fiber in the absence of chromatic dispersion can produce additional wavelengths, resulting in loss of power in the original signals and inter-channel crosstalk. In such scenarios, a minimal amount of chromatic dispersion is desirable to reduce phase matching of optical channels.
Chromatic dispersion is the combined results of two different effects–material dispersion and waveguide dispersion. In silica glass, the speed of the light (refractive index) is dependent on the wavelength of the signal. Material dispersion describes the spreading of an optic pulse due to the different speeds of the optical frequencies that make up that pulse.
Waveguide dispersion refers to differences in the signal speed depending on the distribution of the optical power over the core and cladding of the optic fiber. As the frequency of the optical signal decreases, more of the optical signal is carried in the cladding, which has a different refractive index than the fiber core. So, as in material dispersion, different frequencies within an optical pulse travel at different speeds. Material dispersion and waveguide dispersion tend to have opposite effects (see Figure 1). Fiber manufacturers can manipulate these effects to change the location and slope of the chromatic dispersion curve.
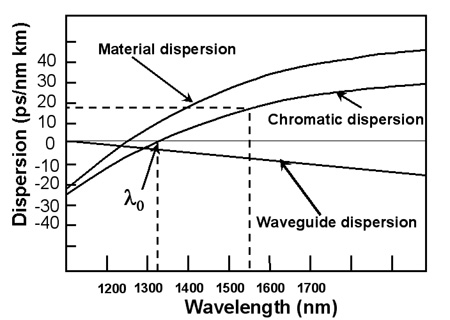
<> Figure 1. Chromatic dispersion is the combined result of material dispersion and waveguide dispersion, which tend to have opposite effects.
The unit of measurement for chromatic dispersion is ps/(nm km), which indicates that a pulse with a spectral width of one nanometer will spread out by one picosecond for every kilometer it travels. For example, to calculate the dispersion of a 1550-nm pulse with a 20-pm (0.02 nm) spectral width (FWHM) as it travels down a 10-km length of fiber that has a dispersion of 17 ps/nm km at 1550nm, we would calculate:
When single-mode fibers first became commercially available, a single1310 nm signal was transmitted, so 1310 nm was targeted to be the zero dispersion wavelength (l0). At this wavelength chromatic dispersion is minimized. In these fibers, known as "standard" fibers, dispersion gradually increases above 1310 until it reaches approximately 17 ps/(nm km) at 1550 nm.
The increase in dispersion was a problem for fiber network providers who wanted to use the low attenuation 1550 nm window for high-speed transmission over long spans. Dispersion-shifted fiber (DSF) is an attempt to optimize that wavelength for high-speed transmission by moving l0 to 1550 nm. DSF worked well, as long as only one wavelength was transmitted on the fiber.
However, when DWDM was attempted on DSF, problems arose. Because the refractive index is partially dependent on the signal intensity, adjacent wavelengths with matching phases can interact to produce spurious signals that rob power from the actual signals and produce noise. This phenomenon is known as four-wave mixing. In the absence of chromatic dispersion, optical channels with closely matched phases can interact over long distances within the fiber.
To prevent four-wave mixing, fiber manufacturers shifted 0 just out of the DWDM range. This shift was done to provide a minimal amount of chromatic dispersion in the DWDM range and reduce the length over which the wavelengths are phase matched, minimizing the four-wave mixing problem. However, as the DWDM range continues to expand, the l0 that provided sufficient chromatic dispersion for earlier DWDM systems may be a problem for later systems.
Network providers who are making necessary upgrades now or planning for future growth are finding they must have more information about the fiber plant that they have in place. Whether they are trying to increase the speed of their transmission, add the latest DWDM equipment, or both, chromatic dispersion is a factor that must be recognized and evaluated to optimize their fiber network.
Testing for chromatic dispersion
There are three methods to determine chromatic dispersion – pulse, phase shift, and optical time domain reflectometry (OTDR). The pulse method measures differential delay between optical pulses of various wavelengths, using a multiple wavelength transmitter at one end of the fiber and a receiver at the other end.
For laboratory work, the phase shift method provides a very accurate method of chromatic dispersion measurement. This method uses a network vector analyzer to measure the phase shift through a fiber as a tunable source varies the wavelength of the transmitted signal. However, equipment required for this measurement is expensive and bulky, and it requires access to both ends of the fiber under test. These factors make this type of measurement impractical for field use.
The OTDR method, such as developed by Anritsu (Richardson, TX), has recently become available. Needing to access only one end of the fiber to make a measurement and having a compact design, the OTDR method is ideal for measuring chromatic dispersion on fibers in the field and in fiber manufacturing. As a result, cable and telephony companies can realize a tremendous business opportunity by expanding the capacity of their existing fiber cable networks to meet continuously expanding customer demand.
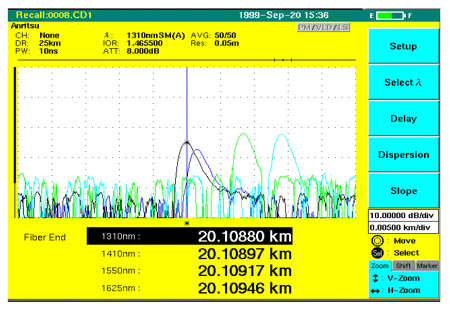
The OTDR method uses four lasers with narrow center wavelength tolerances. The software figures the travel time of each of the four wavelengths to a designated location in the fiber span to calculate the group delay (see Figure 2).
Group delay in standard fiber is calculated using the Sellmeier equation for standard fiber:
For DSF, the equation is:
Typical group delays for standard fiber near 1310 nm and DSF near 1550 nm can be easily calculated (see figures 3 and 4).
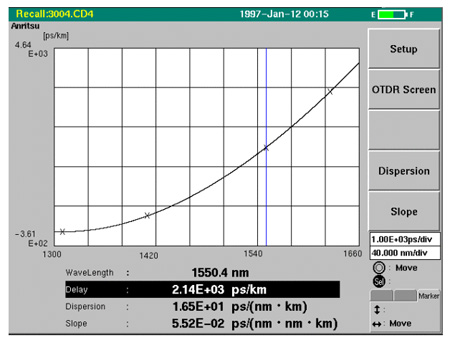
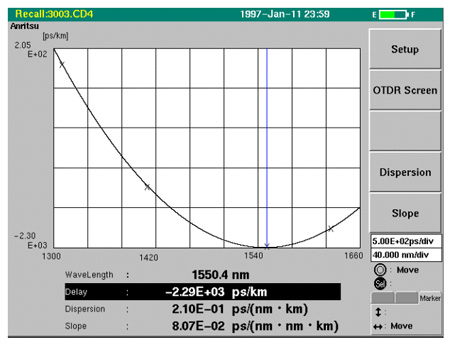
Dispersion is found by differentiating the delay equation with respect to wavelength. The slope is calculated by a second differentiation. Once the measurement and calculation is completed, the delay and dispersion can be read for any wavelength between 1300 and 1650 nm.
While the single-ended access and compact size make the OTDR chromatic dispersion measurement ideal for field testing, the speed and simplicity of the measurement is of interest to fiber and cable manufacturers that need to provide chromatic dispersion data to their customers. In addition to chromatic dispersion measurements, the OTDR method makes standard measurements such as continuity and attenuation at four critical wavelengths.
Network providers with standard fiber networks can transmit high-speed 1550 nm SONET over their fibers by adding special fibers that compensate for the dispersion. These dispersion-compensating fibers are made to counteract the effect of chromatic dispersion by slowing down the wavelengths that have raced ahead and allowing the slow wavelengths to catch up, thus reconstituting optical pulses that may have spread out beyond all recognition.
To apply the correct amount of compensation, an accurate measurement of the amount of dispersion in the span must be made in the field. While this has been difficult in the past, portable single-ended chromatic dispersion testing is an efficient means of gathering this necessary data.
The OTDR method also provides a benefit in the maintenance of high-bandwidth lines. With the dramatic increase in traffic carried over the fiber cause by DWDM, higher speed transmission, or a combination of the two, the ability to measure chromatic dispersion is now a necessity for understanding the performance and capability of a fiber network. Without it, upgrade and network planning will be inadequate, at best.
The early promise of unlimited bandwidth on an optic fiber has proven somewhat elusive. New types of fibers are being introduced that are optimized for new transmission methods and equipment. To plan for future growth, network providers need more information about the fiber plant already in place. Chromatic dispersion information is a key element when planing for the future of a fiber network, whether high-speed SONET or DWDM or a combination is under consideration. In such applications, the OTDR method is the most practical as well as effective means of evaluating the fiber network for carrying the next generation of optical signals.
About the author…
Mike Wilder is a field marketing engineer for Anritsu Company. He holds a bachelors of electrical engineering degree from the Georgia Institute of Technology.